
Use the graph below to answer the question that follows: graph of th...

Use the graph below to answer the question that follows: graph of the curve that passes through the following points, 0, 3; pi over 2, 5; pi, 3; 3 pi over 2, 1; 2 pi, 3. What is the rate of change between the interval of x = 0 and x = pi over two? 2 over pi pi over two pi over four four over pi
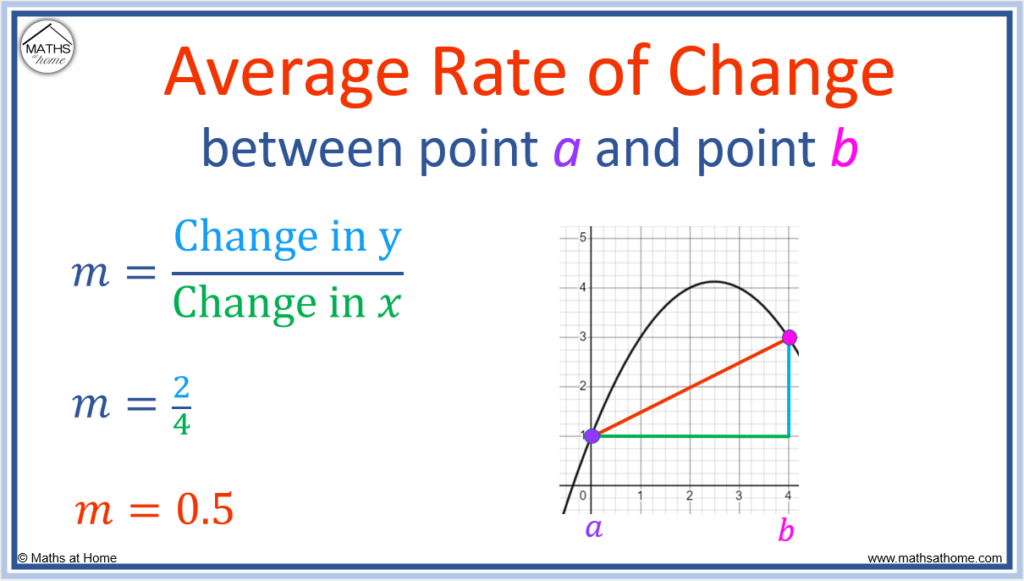
Calculating Rate of Change from a Graph
The question asks for the rate of change of a curve between x = 0 and x = π/2. We're given the points the curve passes through. Rate of change is another way of saying "slope". We can calculate the slope using the provided coordinates.
Calculating the Slope
The rate of change (or slope) between two points (x₁, y₁) and (x₂, y₂) is calculated using the following formula:
Slope = (y₂ - y₁) / (x₂ - x₁)
In our case, the two points are (0, 3) and (π/2, 5). Therefore:
x₁ = 0 y₁ = 3 x₂ = π/2 y₂ = 5 Slope = (5 - 3) / (π/2 - 0) Slope = 2 / (π/2) Slope = 2 * (2/π) Slope = 4/π
Therefore, the rate of change between x = 0 and x = π/2 is 4/π.
Relating Rate of Change to Real-World Examples
Rate of change is a fundamental concept with numerous real-world applications. For example, velocity is the rate of change of position over time. If a car travels 100 miles in 2 hours, its average velocity is 50 miles per hour (the rate of change of its position). Similarly, acceleration is the rate of change of velocity over time. Understanding rate of change helps us analyze and predict how things change over time, from stock prices to temperature fluctuations.
Connecting Rate of Change to Trends
Analyzing rate of change is essential in understanding trends. For instance, in business, the rate of change of sales can indicate growth or decline. In social sciences, the rate of change of population can inform urban planning and resource allocation. Data visualization often relies on graphs to depict these rates of change, making it easier to identify trends and make informed decisions.
FAQ
What is rate of change?
Rate of change describes how one quantity changes in relation to another. It's often represented as the slope of a line on a graph.
How is rate of change calculated?
The rate of change between two points is calculated by dividing the change in the vertical value (y) by the change in the horizontal value (x). This is also known as the slope formula: (y₂ - y₁) / (x₂ - x₁).
Why is understanding rate of change important?
Understanding rate of change is crucial for analyzing trends, making predictions, and understanding how different variables relate to each other in various fields like physics, economics, and social sciences.
Understanding how to calculate the rate of change from a graph, like in this example, provides a visual and practical application of this important concept.

How to Find the Average Rate of Change mathsathome com
Source: mathsathome.com
How to Find the Average Rate of Change mathsathome com
Source: mathsathome.com
Calculating rate of reaction tangent and gradient Teaching Resources
Source: www.tes.com
Average Rate Of Change Using A Table dsullana com
Source: dsullana.com
Rate Of Change Mind Map
Source: www.mindomo.com
Calculating Instantaneous Rate Of Change
Source: learningdbaberdovey.z14.web.core.windows.net
Rate Of Change GCSE Maths Steps Examples Worksheet
Source: thirdspacelearning.com
Average Rate of Change A Quick Brief Education Is Around
Source: educationisaround.com
Rate Of Change GCSE Maths Steps Examples Worksheet
Source: thirdspacelearning.com
How to Find the Rate of Change in Tables Graphs Lesson Study com
Source: study.com
Rate Of Change Graph
Source: ar.inspiredpencil.com
Rate Of Change GCSE Maths Steps Examples Worksheet
Source: thirdspacelearning.com
Rate of Change Calculator the method and complete analysis
Source: theeducationtraining.com
How To Find Average Rate Of Change From A Graph Whether you are in
Source: lmkwupiicd.blogspot.com
Rate of Change YouTube
Source: www.youtube.com
Rate Of Change Graph
Source: ar.inspiredpencil.com
SOLVED:For each graph find the rate of change Remember to use
Source: www.numerade.com
If f(x) = 4x 7 find each function value ppt download
Source: slideplayer.com
Find the rate of change for the given graph below Homework Study com
Source: homework.study.com
Finding Rate Of Change From A Table Worksheets
Source: worksheetaardvark.z13.web.core.windows.net
how to find rate of change on a graph Koch Apans1983
Source: kochapans1983.blogspot.com
Five Minute Check (over Lesson 1 3) Mathematical Practices Then/Now
Source: slideplayer.com
Rate of Change from a Graph YouTube
Source: www.youtube.com
Using a Graph or a Table to Calculate the Average Rate of Change of a
Source: www.youtube.com
Rate Of Change GCSE Maths Steps Examples Worksheet
Source: thirdspacelearning.com
Calculating Rates
Source: www.chem.purdue.edu
Rate Of Change Graph
Source: ar.inspiredpencil.com
Finding The Average Rate of Change of Polynomials Projeda
Source: www.projectglobalawakening.com
How to find the average rate of change mathsathome com calculating reaction tangent and gradient teaching resources using a table dsullana mind map instantaneous gcse maths steps examples worksheet quick brief education is around in tables graphs lesson study graph calculator method complete analysis from whether you are youtube solved:for each remember use if f(x) = 4x 7 function value ppt download for given below homework finding worksheets on koch apans1983 five minute check (over 1 3) mathematical practices then/now or calculate rates polynomials projeda


COMMENTS